
Type of resources
Available actions
Provided by
Years
Formats
Representation types
Update frequencies
Status
Scale
-
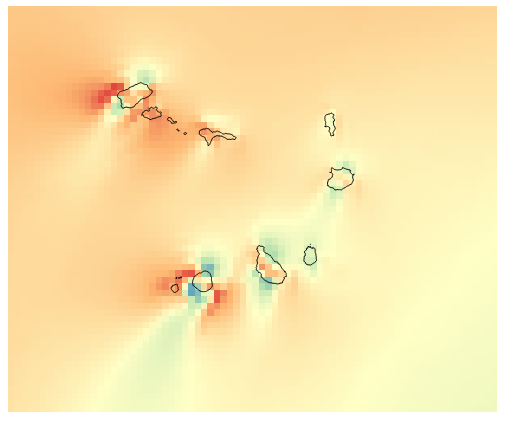
Created by NOVELTIS for ECREEE during the ACP-EU project ECOWREX2. This dataset shows the average Wind Speed at 80 meter high over the year 2013. The average is calculated from hourly time series data generated by NOVELTIS meso-scale Numeric Weather Prediction system. The resolution is 8km x 8km. The unit is m/s. The projection is latlon, EPSG 4326, WGS 84. This dataset is not indicated for local studies but only for regional comparison. The annual average was calculated from hourly time series data generated by NOVELTIS meso-scale Numeric Weather Prediction system over the full 2013 year. The values are calculated from NWP output extracted parameters: U = West-East component of the wind speed V = South-North component of the wind speed. The 2013 year was selected by NOVELTIS as TMY (typical meteorological year) through a regional climatic analysis for the period from 2000 to 2014. Minimum=4.599 m/s Maximum=11.662 m/s Mean=8.632 m/s StdDev=0.666 m/s
-
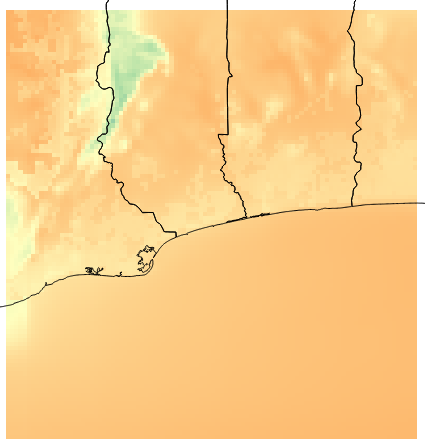
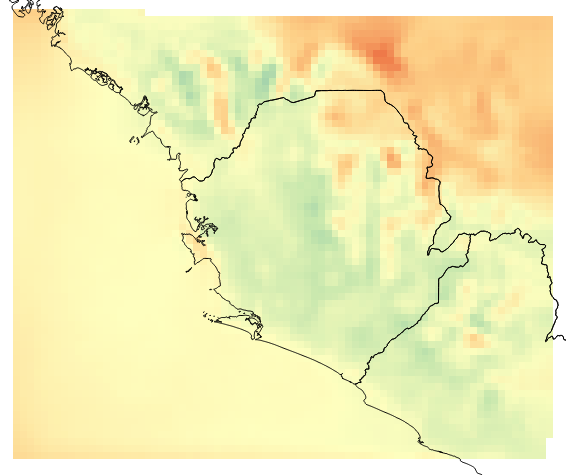
Created by NOVELTIS for ECREEE during the ACP-EU project ECOWREX 2: Promoting Sustainable Energy Development through the use of Geospatial Technologies in West Africa This dataset shows the average temperature at 2 meter over the year 2013. The average is calculated from hourly time series data generated by NOVELTIS meso-scale Numeric Weather Prediction system. The resolution is 4km x 4km. The unit is degree Celsius. Projection is latlon, EPSG 4326, WGS 84. This dataset is not indicated for local studies but only for regional comparison. The annual average was calculated from hourly time series data generated by NOVELTIS meso-scale Numeric Weather Prediction system over the full 2013 year. The parameter extracted from the NWP output is T2 = Temperature at 2 meter. The 2013 year was selected by NOVELTIS as TMY (typical meteorological year) through a regional climatic analysis for the period from 2000 to 2013. Minimum=22.163 °C Maximum=27.466 °C Mean=26.475 °C StdDev=0.641 °C
-
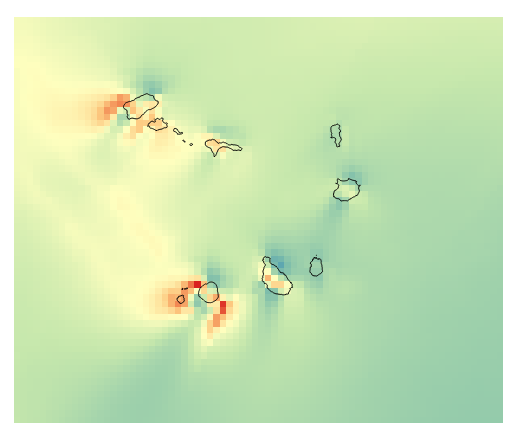
Created by NOVELTIS for ECREEE during the ACP-EU project ECOWREX2. This dataset shows the average Wind Power Density at 100 meter high over the year 2013. The average is calculated from hourly time series data generated by NOVELTIS meso-scale Numeric Weather Prediction system. The resolution is 8km x 8km. The unit is W/m2. The projection is latlon, EPSG 4326, WGS 84. This dataset is not indicated for local studies but only for regional comparison. The annual average was calculated from hourly time series data generated by NOVELTIS meso-scale Numeric Weather Prediction system over the full 2013 year. The values are calculated from NWP output extracted parameters: U = West-East component of the wind speed V = South-North component of the wind speed. ALT = inverse density AL = inverse perturbation density According to the following formula: WPD = 1/2* 1/(ALT+AL) * (WS)3 With WS = √(U2 + V2) The 2013 year was selected by NOVELTIS as TMY (typical meteorological year) through a regional climatic analysis for the period from 2000 to 2014. Minimum=244.157 W/m2 Maximum=1536.362 W/m2 Mean=563.507 W/m2 StdDev=136.221 W/m2
-
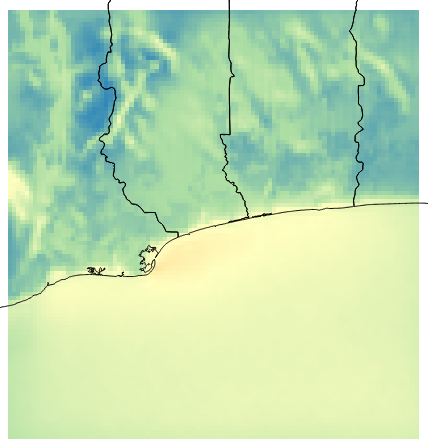
Created by NOVELTIS for ECREEE during the ACP-EU project ECOWREX 2: Promoting Sustainable Energy Development through the use of Geospatial Technologies in West Africa This dataset shows the average Wind Power Density at 40 meter high over the year 2013. The average is calculated from hourly time series data generated by NOVELTIS meso-scale Numeric Weather Prediction system. The resolution is 4km x 4km. The unit is W/m2. Projection is latlon, EPSG 4326, WGS 84. This dataset is not indicated for local studies but only for regional comparison. The annual average was calculated from hourly time series data generated by NOVELTIS meso-scale Numeric Weather Prediction system over the full 2013 year. The values are calculated from NWP output extracted parameters: U = West-East component of the wind speed V = South-North component of the wind speed. ALT = inverse density AL = inverse perturbation density According to the following formula: WPD = 1/2* 1/(ALT+AL) * (WS)3 With WS = √(U2 + V2) The 2013 year was selected by NOVELTIS as TMY (typical meteorological year) through a regional climatic analysis for the period from 2000 to 2014. Minimum=23.017 W/m2 Maximum=183.230 W/m2 Mean=94.257 W/m2 StdDev=34.158 W/m2
-
Created by NOVELTIS for ECREEE during the ACP-EU project ECOWREX2. This dataset shows the average Wind Speed at 60 meter high over the year 2013. The average is calculated from hourly time series data generated by NOVELTIS meso-scale Numeric Weather Prediction system. The resolution is 8km x 8km. The unit is degree m/s. The projection is latlon, EPSG 4326, WGS 84. This dataset is not indicated for local studies but only for regional comparison. The annual average was calculated from hourly time series data generated by NOVELTIS meso-scale Numeric Weather Prediction system over the full 2013 year. The values are calculated from NWP output extracted parameters: U = West-East component of the wind speed V = South-North component of the wind speed. The 2013 year was selected by NOVELTIS as TMY (typical meteorological year) through a regional climatic analysis for the period from 2000 to 2014. Minimum=4.604 m/s Maximum=11.604 m/s Mean=8.544 m/s StdDev=0.657 m/s
-
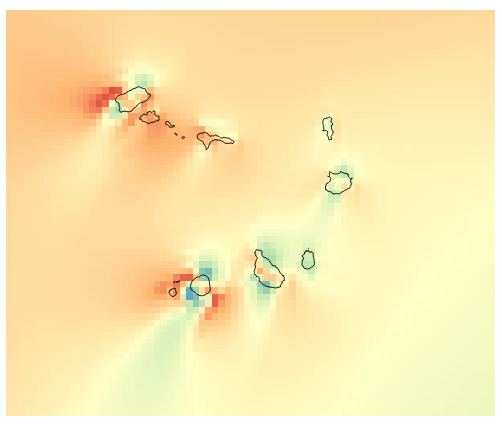
Created by NOVELTIS for ECREEE during the ACP-EU project ECOWREX2. This dataset shows the average Wind Speed at 100 meter high over the year 2013. The average is calculated from hourly time series data generated by NOVELTIS meso-scale Numeric Weather Prediction system. The resolution is 8km x 8km. The unit is m/s. The projection is latlon, EPSG 4326, WGS 84. This dataset is not indicated for local studies but only for regional comparison. The annual average was calculated from hourly time series data generated by NOVELTIS meso-scale Numeric Weather Prediction system over the full 2013 year. The values are calculated from NWP output extracted parameters: U = West-East component of the wind speed V = South-North component of the wind speed. The 2013 year was selected by NOVELTIS as TMY (typical meteorological year) through a regional climatic analysis for the period from 2000 to 2014. Minimum=3.579 m/s Maximum=7.085 m/s Mean=5.098 m/s StdDev=0.522 m/s
-
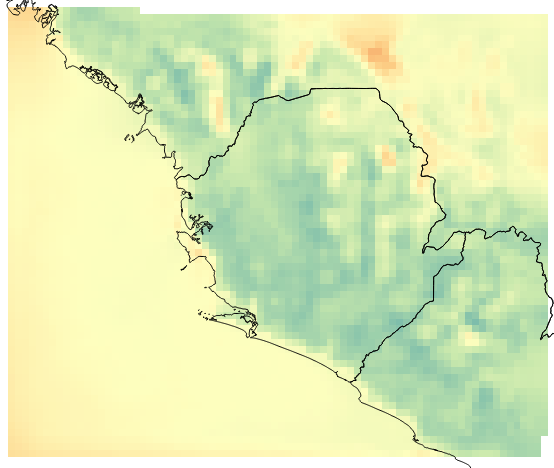
Created by NOVELTIS for ECREEE during the ACP-EU project ECOWREX2. This dataset shows the average Wind Speed at 60 meter high over the year 2013. The average is calculated from hourly time series data generated by NOVELTIS meso-scale Numeric Weather Prediction system. The resolution is 8km x 8km. The unit is m/s. The projection is latlon, EPSG 4326, WGS 84. This dataset is not indicated for local studies but only for regional comparison. The annual average was calculated from hourly time series data generated by NOVELTIS meso-scale Numeric Weather Prediction system over the full 2013 year. The values are calculated from NWP output extracted parameters: U = West-East component of the wind speed V = South-North component of the wind speed. The 2013 year was selected by NOVELTIS as TMY (typical meteorological year) through a regional climatic analysis for the period from 2000 to 2014. Minimum=2.984 m/s Maximum=6.236 m/s Mean=4.523 m/s StdDev=0.628 m/s
-
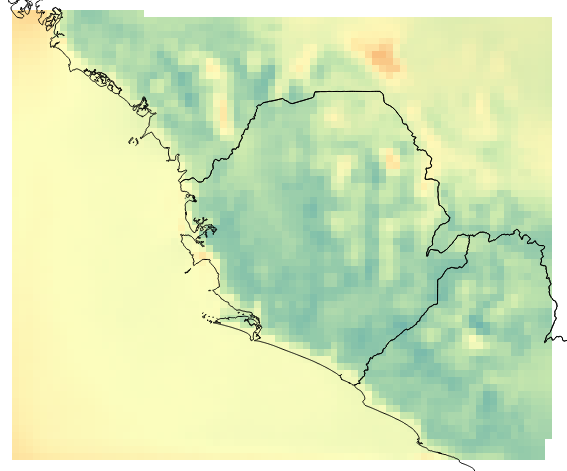
Created by NOVELTIS for ECREEE during the ACP-EU project ECOWREX2. This dataset shows the average Wind Speed at 40 meter high over the year 2013. The average is calculated from hourly time series data generated by NOVELTIS meso-scale Numeric Weather Prediction system. The resolution is 8km x 8km. The unit is m/s. The projection is latlon, EPSG 4326, WGS 84. This dataset is not indicated for local studies but only for regional comparison. The annual average was calculated from hourly time series data generated by NOVELTIS meso-scale Numeric Weather Prediction system over the full 2013 year. The values are calculated from NWP output extracted parameters: U = West-East component of the wind speed V = South-North component of the wind speed. The 2013 year was selected by NOVELTIS as TMY (typical meteorological year) through a regional climatic analysis for the period from 2000 to 2014. Minimum=2.696 m/s Maximum=5.843 m/s Mean=4.310 m/s StdDev=0.709 m/s
-

This dataset shows sub-areas (sub-catchments) for West Africa and the estimated hydropower potential as well as several other interesting attributes for hydro power development. This dataset is not intended for local studies but only for regional comparison. The dataset was created using the following methodology: 1. Creation of the sub-catchment boundaries using the river network and the Hydrosheds 15s flow direction grid. Outlet points of sub-catchments were defined as the last cell point of river reaches, where the accumulated upstream catchment size exceeds 3000 km². In coastal areas the threshold was reduced to 1000 km². Outlet points were manually adjusted at large reservoirs. 2. Water balance and climate change variables were joined into GIS from the simulation outputs of a Fortran water balance model. Climate change scenario simulation results are based on the CORDEX Africa ensemble (RCP4.5 and RCP8.5). 3. Theoretical hydropower potential data were aggregated to sub-area values from detailed simulation results at the river network. 4. Attractive regions were identified using a classification system based on hydropower potential. 5. Hydropower plant types are based on a rough classification system using river network data, including mean annual discharge, seasonality in discharge and river slope. Local site studies may result in different suitable plant types. 6. Preferred machine types are based on a rough classification system using river slope and plant type. The following tools were used for creating this dataset: • ArcGIS 9.2: main GIS tool • ArcView 3.1: specific tasks with large attribute tables where more recent GIS versions fail • Fortran: main processing tool for various tasks o Pre-processing of GPCC and satellite precipitation data o Water balance modelling o Sub-catchment outlets definition • MS Excel: some data pre-processing and visualization • Libre Office: dbf file manipulation • CDO: Climate Data Operators for processing of CORDEX-Africa climate model data • Shell scripts: For automatic file processing of climate model data • Batch scripts: For automatic calls to Fortran programs For each sub-area the following attributes are available (units in brackets): • NB: ID number of sub-area • AREA: Local size (km²) of sub-area • PRECIP_Y: Mean annual precipitation (mm) in the period 1998-2014 • ETA_Y: Mean annual actual evapotranspiration (mm) simulated for the period 1998-2014 • RUNOFF_Y: Mean annual runoff (mm) simulated for the period 1998-2014 • TEMP_Y: Mean annual air temperature (°C) in the period 1998-2014 • P_2035_P25: Change in future mean annual precipitation in % (2026-2045 vs. 1998-2014) for the lower quartile projection of 30 climate model runs in the CORDEX-Africa ensemble (RCP4.5 and RCP8.5) • P_2035_P50: Change in future mean annual precipitation in % (2026-2045 vs. 1998-2014) for the median projection of 30 climate model runs in the CORDEX-Africa ensemble (RCP4.5 and RCP8.5) • P_2035_P75: Change in future mean annual precipitation in % (2026-2045 vs. 1998-2014) for the upper quartile projection of 30 climate model runs in the CORDEX-Africa ensemble (RCP4.5 and RCP8.5) • P_2055_P25: Change in future mean annual precipitation in % (2046-2065 vs. 1998-2014) for the lower quartile projection of 30 climate model runs in the CORDEX-Africa ensemble (RCP4.5 and RCP8.5) • P_2055_P50: Change in future mean annual precipitation in % (2046-2065 vs. 1998-2014) for the median projection of 30 climate model runs in the CORDEX-Africa ensemble (RCP4.5 and RCP8.5) • P_2055_P75: Change in future mean annual precipitation in % (2046-2065 vs. 1998-2014) for the upper quartile projection of 30 climate model runs in the CORDEX-Africa ensemble (RCP4.5 and RCP8.5) • E_2035_P25: Change in future mean annual actual evapotranspiration in % (2026-2045 vs. 1998-2014) for the lower quartile simulation using 30 climate model runs of the CORDEX-Africa ensemble (RCP4.5 and RCP8.5) • E_2035_P50: Change in future mean annual actual evapotranspiration in % (2026-2045 vs. 1998-2014) for the median simulation using 30 climate model runs of the CORDEX-Africa ensemble (RCP4.5 and RCP8.5) • E_2035_P75: Change in future mean annual actual evapotranspiration in % (2026-2045 vs. 1998-2014) for the upper quartile simulation using 30 climate model runs of the CORDEX-Africa ensemble (RCP4.5 and RCP8.5) • E_2055_P25: Change in future mean annual actual evapotranspiration in % (2046-2065 vs. 1998-2014) for the lower quartile simulation using 30 climate model runs of the CORDEX-Africa ensemble (RCP4.5 and RCP8.5) • E_2055_P50: Change in future mean annual actual evapotranspiration in % (2046-2065 vs. 1998-2014) for the median simulation using 30 climate model runs of the CORDEX-Africa ensemble (RCP4.5 and RCP8.5) • E_2055_P75: Change in future mean annual actual evapotranspiration in % (2046-2065 vs. 1998-2014) for the upper quartile simulation using 30 climate model runs of the CORDEX-Africa ensemble (RCP4.5 and RCP8.5) • R_2035_P25: Change in future mean annual runoff in % (2026-2045 vs. 1998-2014) for the lower quartile simulation using 30 climate model runs of the CORDEX-Africa ensemble (RCP4.5 and RCP8.5) • R_2035_P50: Change in future mean annual runoff in % (2026-2045 vs. 1998-2014) for the median simulation using 30 climate model runs of the CORDEX-Africa ensemble (RCP4.5 and RCP8.5) • R_2035_P75: Change in future mean annual runoff in % (2026-2045 vs. 1998-2014) for the upper quartile simulation using 30 climate model runs of the CORDEX-Africa ensemble (RCP4.5 and RCP8.5) • R_2055_P25: Change in future mean annual runoff in % (2046-2065 vs. 1998-2014) for the lower quartile simulation using 30 climate model runs of the CORDEX-Africa ensemble (RCP4.5 and RCP8.5) • R_2055_P50: Change in future mean annual runoff in % (2046-2065 vs. 1998-2014) for the median simulation using 30 climate model runs of the CORDEX-Africa ensemble (RCP4.5 and RCP8.5) • R_2055_P75: Change in future mean annual runoff in % (2046-2065 vs. 1998-2014) for the upper quartile simulation using 30 climate model runs of the CORDEX-Africa ensemble (RCP4.5 and RCP8.5) • T_2035_P25: Change in future mean annual air temperature in °C (2026-2045 vs. 1998-2014) for the lower quartile projection of 30 climate model runs in the CORDEX-Africa ensemble (RCP4.5 and RCP8.5) • T_2035_P50: Change in future mean annual air temperature in °C (2026-2045 vs. 1998-2014) for the median projection of 30 climate model runs in the CORDEX-Africa ensemble (RCP4.5 and RCP8.5) • T_2035_P75: Change in future mean annual air temperature in °C (2026-2045 vs. 1998-2014) for the upper quartile projection of 30 climate model runs in the CORDEX-Africa ensemble (RCP4.5 and RCP8.5) • T_2055_P25: Change in future mean annual air temperature in °C (2046-2065 vs. 1998-2014) for the lower quartile projection of 30 climate model runs in the CORDEX-Africa ensemble (RCP4.5 and RCP8.5) • T_2055_P50: Change in future mean annual air temperature in °C (2046-2065 vs. 1998-2014) for the median projection of 30 climate model runs in the CORDEX-Africa ensemble (RCP4.5 and RCP8.5) • T_2055_P75: Change in future mean annual air temperature in °C (2046-2065 vs. 1998-2014) for the upper quartile projection of 30 climate model runs in the CORDEX-Africa ensemble (RCP4.5 and RCP8.5) • POWER: Theoretical hydropower potential (MW) for the period 1998-2014 (total of all river reaches located in the sub-area) • POW_MINI: Theoretical hydropower potential (MW) for pico/micro/mini hydropower plants (< 1 MW installed capacity) for the period 1998-2014 • POW_SMALL: Theoretical hydropower potential (MW) for small hydropower plants (1-30 MW installed capacity) for the period 1998-2014 • POW_MEDIUM: Theoretical hydropower potential (MW) for medium/large hydropower plants (>30 MW installed capacity) for the period 1998-2014 • ATT_MINI: Region with theoretical hydropower potential that is attractive (0: no, 1: yes) for pico/micro/mini hydropower plants (< 1 MW installed capacity) • ATT_SMALL: Region with theoretical hydropower potential that is attractive (0: no, 1: yes) for small hydropower plants (1-30 MW installed capacity) • ATT_MEDIUM: Region with theoretical hydropower potential that is attractive (0: no, 1: yes) for medium/large hydropower plants (> 30 MW installed capacity) • PLANT_TYP1: Region suitable (0: no, 1: yes) for hydropower plant type 1 (run-of-river without diversion) • PLANT_TYP2: Region suitable (0: no, 1: yes) for hydropower plant type 2 (run-of-river with diversion) • PLANT_TYP3: Region suitable (0: no, 1: yes) for hydropower plant type 3 (storage without diversion) • PLANT_TYP4: Region suitable (0: no, 1: yes) for hydropower plant type 4 (storage with diversion) • TURBINE: Preferred turbine type (text) • PT_2035_25: Change in future hydropower potential in % (2026-2045 vs. 1998-2014) for the lower quartile simulation using 30 climate model runs of the CORDEX-Africa ensemble (RCP4.5 and RCP8.5) • PT_2035_50: Change in future hydropower potential in % (2026-2045 vs. 1998-2014) for the median simulation using 30 climate model runs of the CORDEX-Africa ensemble (RCP4.5 and RCP8.5) • PT_2035_75: Change in future hydropower potential in % (2026-2045 vs. 1998-2014) for the upper quartile simulation using 30 climate model runs of the CORDEX-Africa ensemble (RCP4.5 and RCP8.5) • PT_2055_25: Change in future hydropower potential in % (2046-2065 vs. 1998-2014) for the lower quartile simulation using 30 climate model runs of the CORDEX-Africa ensemble (RCP4.5 and RCP8.5) • PT_2055_50: Change in future hydropower potential in % (2046-2065 vs. 1998-2014) for the median simulation using 30 climate model runs of the CORDEX-Africa ensemble (RCP4.5 and RCP8.5) • PT_2055_75: Change in future hydropower potential in % (2046-2065 vs. 1998-2014) for the upper quartile simulation using 30 climate model runs of the CORDEX-Africa ensemble (RCP4.5 and RCP8.5) • PL_2035_25: Change in future hydropower potential in % (2026-2045 vs. 1998-2014) of local rivers (having their source in the same sub-area) for the lower quartile simulation using 30 climate model runs of the CORDEX-Africa ensemble (RCP4.5 and RCP8.5) • PL_2035_50: Change in future hydropower potential in % (2026-2045 vs. 1998-2014) of local rivers (having their source in the same sub-area) for the median simulation using 30 climate model runs of the CORDEX-Africa ensemble (RCP4.5 and RCP8.5) • PL_2035_75: Change in future hydropower potential in % (2026-2045 vs. 1998-2014) of local rivers (having their source in the same sub-area) for the upper quartile simulation using 30 climate model runs of the CORDEX-Africa ensemble (RCP4.5 and RCP8.5) • PL_2055_25: Change in future hydropower potential in % (2046-2065 vs. 1998-2014) of local rivers (having their source in the same sub-area) for the lower quartile simulation using 30 climate model runs of the CORDEX-Africa ensemble (RCP4.5 and RCP8.5) • PL_2055_50: Change in future hydropower potential in % (2046-2065 vs. 1998-2014) of local rivers (having their source in the same sub-area) for the median simulation using 30 climate model runs of the CORDEX-Africa ensemble (RCP4.5 and RCP8.5) • PL_2055_75: Change in future hydropower potential in % (2046-2065 vs. 1998-2014) of local rivers (having their source in the same sub-area) for the upper quartile simulation using 30 climate model runs of the CORDEX-Africa ensemble (RCP4.5 and RCP8.5)
-

Existing and planned transmission grid network (medium and high voltage lines) in the ECOWAS Region. Also covers other regions of West Africa. The Dataset comes from the West African Power Pool (WAPP) GIS database January 2017. WAPP is the source of the information. The Institution collects and validates spatial information on transmission lines in a yearly basis.